
The Hitchhiker’s Guide to Measuring Engineering ROI
CTOs & Engineering VPs: What is your ROI story?

The Challenge of Attributing ROI
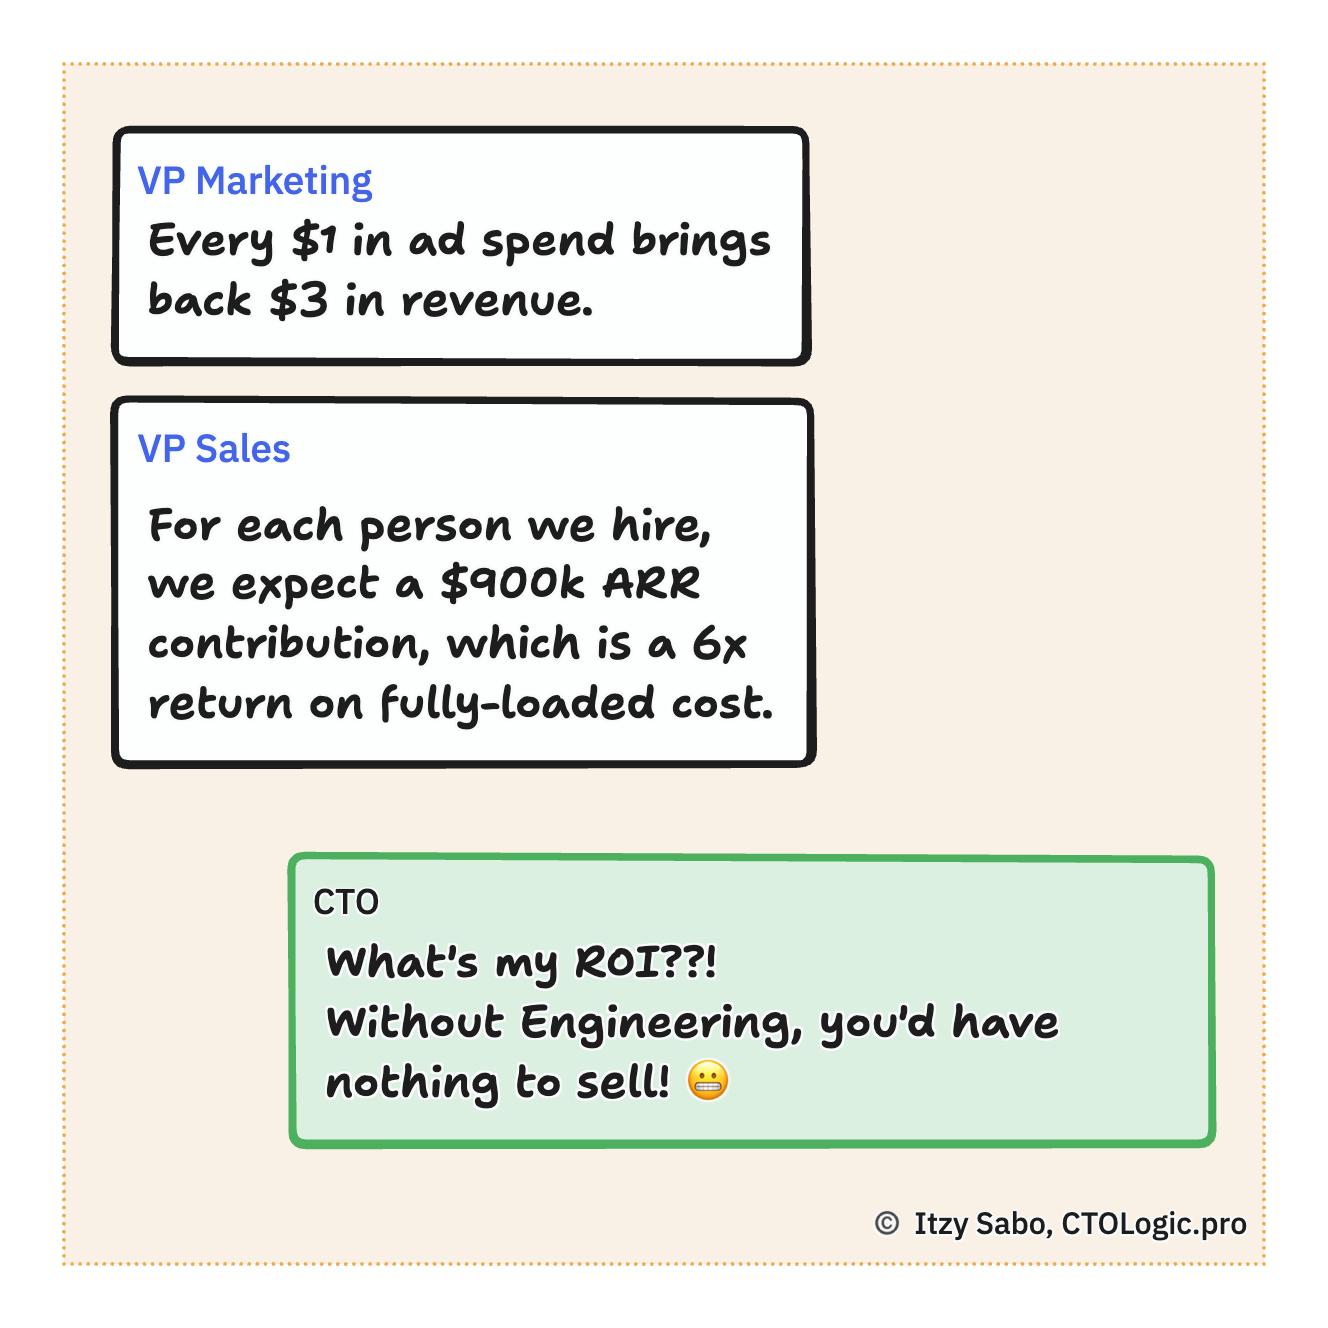
Your marketing VP may tell you that for every dollar she spends, the company gets back $3 in revenue.
Sales people are measured by the amount of revenue they book. It’s probably the primary determining factor of how much they take home.
In contrast with our VPs of Marketing and Sales above, many CTOs can tell you only this: “Without my department, we wouldn’t have anything to sell.” Correct, but not useful.
The connection between engineering and revenue is not clearly visible, and in most cases is actually quite elusive. This is for two inter-related reasons: the lack of a clear cause-and-effect relationship, and the tendency of results to lag significantly behind the corresponding efforts.
The engineering department’s job is to build and maintain the company’s core revenue engine. Engineering, therefore, obviously plays a central role in the company’s success.
Attempts to attribute a fair portion of the company’s business outcomes to the engineering department are seriously challenged by the tension between engineering’s key role, on one side, and the opaqueness of the chain of causation between engineering work and business outcomes, on the other.
Why Quantify Engineering ROI?
Before we attempt to solve the challenge, let’s examine why we need to do it in the first place.
It’s natural to want to know how well engineering — one of a startup’s most expensive departments — is running. The marketing and sales departments can provide simple numbers, directly tied to revenue, that give a good snapshot of how well they are functioning. It’s only natural to try to get a similarly succinct number from engineering.
When asked, “What is Engineering’s ROI?” the CTO feels pressured to answer it, but often doesn’t have the tools. So the CTO counters with DORA metrics, uptime percentages, bug rates, and developer experience (DX) evaluations. None of these translate into a bottom line revenue number. In extreme cases, CTOs have even been known to claim that engineering creativity and innovation cannot be quantified, and should not be measured.
Even though everyone appreciates the difficulty, the CTO’s inability to account for the high costs of their engineering department is nevertheless perceived as the CTO’s own personal shortcoming.
Even if the CTO manages to present the above metrics impressively, the fundamental lack of ROI data remains, because (for example):
Efficiency does not imply effectiveness.
Shipping features does not necessarily bring in revenue.
Velocity does not indicate value.
A seemingly excellent engineering department can generate a quite low ROI, if it does not pull in the direction of some very specific business outcomes. One infamous archetype that exhibits this behaviour is known as the “feature factory.”
The pressure to understand the engineering department’s ROI is typically an attempt to validate whether the high costs are worthwhile. However, if you do it right, you can turn this process into a tool that will actually generate a higher ROI.
The ROI Mindset
The main difficulty with measuring ROI is that it requires mindset changes from the CTO himself, the CEO, and the other executives.
Outcomes versus Outputs
ROI revolves around business outcomes, yet in many companies the engineering department merely delivers requested outputs, in the form of features. In such cases, the head of engineering can be held accountable only for outputs, and they will be unable to optimise for ROI — even if the CFO actually calculates it using some arbitrary formula. In many such output-driven feature-centric companies, no executive will be explicitly responsible to ensure that the requested outputs plausibly align with the company’s business goals, let alone be truly accountable for the eventual outcomes.
If we want true accountability for outcomes, we need to assign the corresponding responsibility and authority. Of course, we need a CTO who is worthy of these, and can properly fill “a seat at the table.”
Leading Indicators
In order to be able to get any inkling of ROI, we need to make a habit of circling back to measure usage of new features, and how they contribute to acquisition, retention, or whatever their stated aim was.
Business outcomes tend to surface in lagging metrics — calculated well after deployment of the changes that we hoped would drive the results we need.
Therefore, CTOs must ensure that relevant leading indicators are identified, that can be used as early litmus tests. This also highlights the imperative to invest in observability and analytics — something which many output-oriented engineering departments feel they have little time for. They see it as a separate effort, distinct from the main deliverable, and which will just slow them down. A mindset that is more conducive to ROI would be, “a feature isn’t complete without observability.”
Advantages of measuring and monitoring leading indicators:
Prediction — Leading indicators allow us to track, predict and report success early.
Attribution — Suitable leading indicators make it easier to attribute results to specific efforts and features, compared with lagging metrics, which are aggregate effects of multiple phenomena.
Savings of time and resources — By monitoring leading indicators, we can make early course corrections, thus saving time and reducing waste of engineering resources on avenues that we discover to be doomed to fail.
Increased likelihood of success — We can increase our focus on the intended results, and therefore our likelihood of attaining them, by clarifying from the outset which observations will indicate how successful a feature is considered, and by selecting appropriate leading indicators. (I teach techniques to identify intended outcomes and relevant leading indicators, such as The 5 Whats and Definition of Success.)
How to Demonstrate ROI
Here are a number of methods that can be used, individually or in combination, to form an impression of the ROI of your engineering department, and determine whether it is “enough.”
A. Compare Reality With Expectations
The most natural method, in use almost everywhere, is to compare reality with your original expectations. Are you getting what you expected from engineering? This amounts to a gut feeling, and it is especially prone to conflation of the following factors:
Are you satisfied with engineering’s performance? Did they deliver what was requested, on time, and with good quality? Any such satisfaction has nothing to do with ROI.
Are you satisfied with the business outcomes that were enabled by engineering’s efforts? If not, should this low ROI reflect back on engineering’s standing in your eyes? After all, engineering itself may have nevertheless performed outstandingly, even though your bets didn’t win.
B. Compare Yourself Against Benchmarks
Current financial benchmarks will tell you whether your engineering costs as a percentage of revenue are consistent with other companies. Your assumption may be that if your investment follows the benchmark, and you’re satisfied with engineering, all is good. But how good is it exactly?
Such benchmarks have a lot of play in them, depending on your industry, and also the growth stage you’re at. For example, a company that has pulled its acceleration lever to scale rapidly after finding product-market-fit (PMF) might increase engineering spending past 60% of revenue, whereas larger, more stable companies will tend to spend a lower percentage.
It is worth explaining that if you invest 60% of your revenue on engineering, that does not mean that engineering ROI is 100÷60 = 167%. The revenue arriving now is most probably not a result of your current spending.
True ROI is a measure of how well your past engineering investments are influencing current revenue, or how well today’s bets will convert into future payoffs. Startups are notorious for their high failure rate at this game.
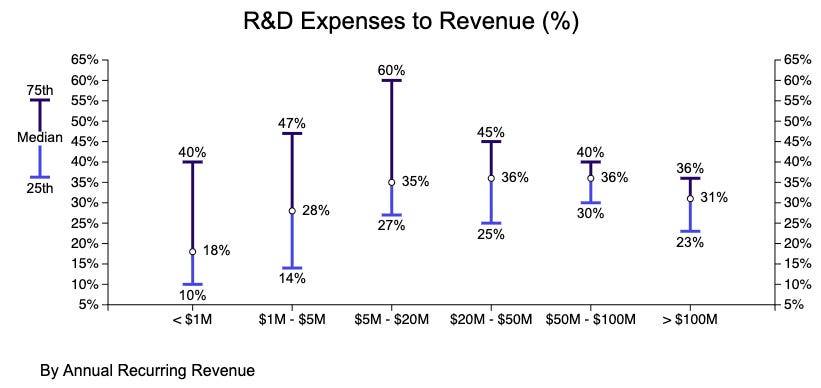
Source: Benchmarkit’s 2025 B2B SaaS Performance Metrics Benchmarks
C. Demonstrate ROI via Initiatives that Drive ROI
I have successfully used this model at multiple companies, and it forms the core of the method I teach CTOs that work with me. It’s a 3-stage process that’s simple to grasp, but which requires more than technology skills alone to carry it out.
Identify
Identify business outcomes that the company needs. Ideally, you will derive these directly from your company’s business goals, and agreed upon business strategies that form approaches for achieving the goals. If such goals or strategies don’t exist in coherent form, you will need to play an important part in clarifying and crystallising them, because without a clear business direction, you’ll get nowhere useful.Commit
Design technology initiatives that will result in the outcomes you identified. You cannot do this in a vacuum — you must align and collaborate with your fellow executive leaders. This collaboration has the potential to position you as a capable and trusted partner who leverages technology, and the centrality of the engineering department, in pursuit of the company’s business goals.Deliver & Report
Execute the initiatives and ensure you deliver the results. An integral part of this requires proper tracking and reporting of results.
By committing to solve specific business problems and to achieve specific business outcomes, and then honouring those commitments, you are demonstrating your value as a leader, and attributing to your engineering department the credit for those specific outcomes.
Here’s an example to demonstrate:
Business goal:
Increase Annual Recurring Revenue (ARR) by 60%
There are many ways to achieve this goal. Multiple business strategies that are agreed upon, including:
Reduce monthly churn down to 11%, to boost MRR in powerfully compounding way
The CTO defines the following initiative:
Identify and fix our top 3 churn triggers (in order to boost MRR independently of traffic or conversion rates)
Later, even before the full effect has been felt, the CTO is happy to report:
We cut churn from 20% → 10%, by fixing our top 5 churn triggers.
It’s a +$10M (+34%) boost to our projected 12-month revenue.
A CTO who can intentionally deliver highly relevant business outcomes, and who can also demonstrate progress using relevant indicators and metrics, is achieving a “high ROI,” even though such a statement may be based on an unquantified intuition.
In this example, based on a development cost of a few hundred thousand dollars, the company got amazing value for money.
Engineer your pathway to ROI
My next free online workshop for SaaS CTOs and Engineering VPs will get you started immediately with practical steps to deliver, demonstrate and boost engineering ROI.
In 60 minutes, I’ll teach you the framework that has helped 120+ engineering leaders get started on optimising their departments and operations for maximum ROI.
D. Calculate ROI using a Formula
The initiatives approach gives results that are undeniably powerful. However, these results are expressed anecdotally, and cannot necessarily be mathematically aggregated across initiatives to produce a standardised measurement.
If we want to gauge how much leverage the company is getting from its engineering department, we need a method of attributing financial results to all the relevant departments.
Companies tend to come up with their own formulae, or at least their own way of applying them. Anyone doing so should consider the following factors:
Attribution Philosophies
There are three philosophies regarding ROI attribution (excuse my borrowing of marketing terminology here):
Full Attribution (a.k.a. “Single-Touch”)
Attribute 100% of the impact to the department or initiative that is most closely associated to the final conversion.Fractional Attribution (a.k.a “Multi-Touch”)
Split the attribution across contributing departments, according to their proportional contributions. Some companies will attribute arbitrary percentages of revenue e.g. 30% for marketing, 40% for sales, etc.Causal Attribution (a.k.a. Incremental Attribution)
When there is an incremental lift (“delta”) in a metric, attribute the resulting effect to the initiative or department that caused it.
There are many drawbacks with these philosophies, for example:
The full attribution philosophy ignores the inter-departmental teamwork that underpins any product, crediting only the last department in the chain. This will naturally concentrate most of the perceived value in the marketing or sales departments. Additionally, for each type of revenue-generating conversion, including new ones that arise, you’ll need to discuss and define which department exclusively gets the credit.
Fractional attribution seems significantly more fair, yet using arbitrary weightings encourages never-ending negotiations about adjusting the weightings.
Causal Attribution can be problematic to implement properly, for a number of reasons.
Revenue will need to be broken down and attributed to many different efforts. It quickly gets impractically nitpicky.
If an increase in the percentage of landing page visitors who registered free accounts eventually turned into more paying customers, was this because engineering streamlined the registration form or because marketing figured out how to bring better quality traffic? Or both? Or neither?
Attributing an intentional improvement in a leading indicator can be practical, but isolating its eventual effect on the lagging revenue metric is often not feasable among the noise generated by many concurrent efforts.
There are potentially some damaging second-order effects of full attribution, and to some degree fractional attribution, depending on the split. For example, engineering may have no incentive to prioritise work that sales will get credit for, over work that directly helps engineering’s own ROI score.
Attribution by Activity or Revenue Type
The above attribution philosophies are concerned mainly with who to attribute revenue to.
In many cases, it may make sense to overlay this with an orthogonal dimension that denotes the what — activities that led or contributed to revenue-generating events. Dave McClure’s famous AARRR Pirate Metrics framework provides a convenient list (I’ve tweaked it for my own purposes):
Acquisition of new users.
Activation of the new users — i.e. getting them to their Aha moments.
Revenue — converting free users into paying customers.
Retention of paying customers for as long as possible, to maximise their lifetime value (LTV). This will also include upgrading them to higher cost packages, known as “expansions” in accounting language.
Referral — getting customers to refer others who become customers.
A simplification of this that might be preferred by some companies could distinguish just between new and pre-existing revenue. For example:
New revenue — revenue received from customers who converted during the reporting period. This could be attrbuted to the marketing department, or to sales, or split across both, because these departments’ efforts were the key contributions here.
Pre-existing revenue — recurring revenue from customers who converted prior to the beginning of the reporting period. A company might decide to attribute retained revenue to the engineering department, because a high quality user experience that delivers value consistently is much more conducive to retention.
This approach essentially boils down to a breakdown of “Single-Touch” attribution by revenue type.
Another perspective is not to differentiate by revenue type, but by the intended purpose of investment. Most basically, this can be expressed as follows:
Keep the lights on (KTLO) — Efforts and expenses that are required to keep the product functioning smoothly with its current feature set and customer base. This maps (roughly) to what the CFO calls operating expenses, or “OpEx” for short.
New features and capabilities — Investment in new features and capabilities such as scaling up the infrastructure to support a larger customer base. This is what the finance people call capital expenditure (“CapEx”).
CFOs care about the distinction between OpEx and CapEx because these expenditures are treated differently in financial reports (CapEx are reported as assets, while OpEx are expenses), and have differing effects on taxes owed and even influence the company’s valuation differently.
Distinguishing between OpEx and CapEx is logically understandable, but attempting to attribute incoming revenue to the corresponding type of investment is impractical in many cases.
Additional Factors to Consider
Risk Mitigation
A significant portion of engineering work mitigates risks, to prevent potential losses and other adverse events. Production downtime can have a high direct cost through loss of revenue (e.g. in ecommerce), and also can be accompanied by an indirect cost in the form of reputational damage. The attribution problem here is not the who, but the amount. We can know exactly how much we invested, but any figure we put on the potential damage we prevented (multiplied by a probability percentage we pick) is purely imaginary — because if our effort is successful, the events do not happen.1 Will we factor this type of activity into our ROI formula, and if so, how?
Actual vs. Predicted Revenue
Do we care only about actual revenue accrued during the reporting period, or will we attempt to estimate the net present value (NPV) of all improvements?
Time-lag
Do we care that investment and payback periods could be offset from each other, e.g. investment over a sustained period that starts paying off only once it is complete? The residual effect will persist — for how long should we attribute this to the original investment?
Intent
Do we care whether an effect is due to deliberate effort? For example, if we increased revenue by raising prices, does anyone get credit for that (apart from the decision-maker)? What about if we got more business because a competitor had a serious outage? Do we care to differentiate between internal and external causes?
Stability
How stable is our formula? How prone is it to constant renegotiation attempts? How sensitive is it to changing industry or market realities?
Incentive
Is one of the aims of our ROI formula to serve as an incentive for departments to improve? Might our formula cause territorial disputes and dis-incentivise the departments from collaborating? How can we avoid dis-incentivising investments that do not obviously generate revenue (see risk mitigation above), and therefore lower a department’s ROI score (mathematically)?
Fairness
Are we trying to be fair? If so, why exactly? Is it just to prevent squabbling? How does fairness affect each department’s incentive to improve? Will a fair formula encourage collaboration between departments?
Availability, Clarity, Estimatability and Mechanical Simplicity
How readily available are the up-to-date numbers for calculating the formula? How easy is it for a department head to calculate or estimate their current situation? To what degree are the attributions and amounts subject to a determination by the CFO before they can be relied upon? Can a department head understand clearly how to adjust their activities in order to improve their ROI over time?
What Makes an ROI Formula Useful?
I’m not looking for an academic formula that produces a number that has little practical value in real time. My formula needs to be useful. To me, that means it must do as many of these as possible:
Track something meaningful over time.
Create a timely feedback loop for departments to improve the score.
Help engineering compete for budgets and resources with the other departments.
Align the departments’ incentives so they all pull in the same direction.
Be comparable between companies, e.g. in a private equity portfolio. Optional.
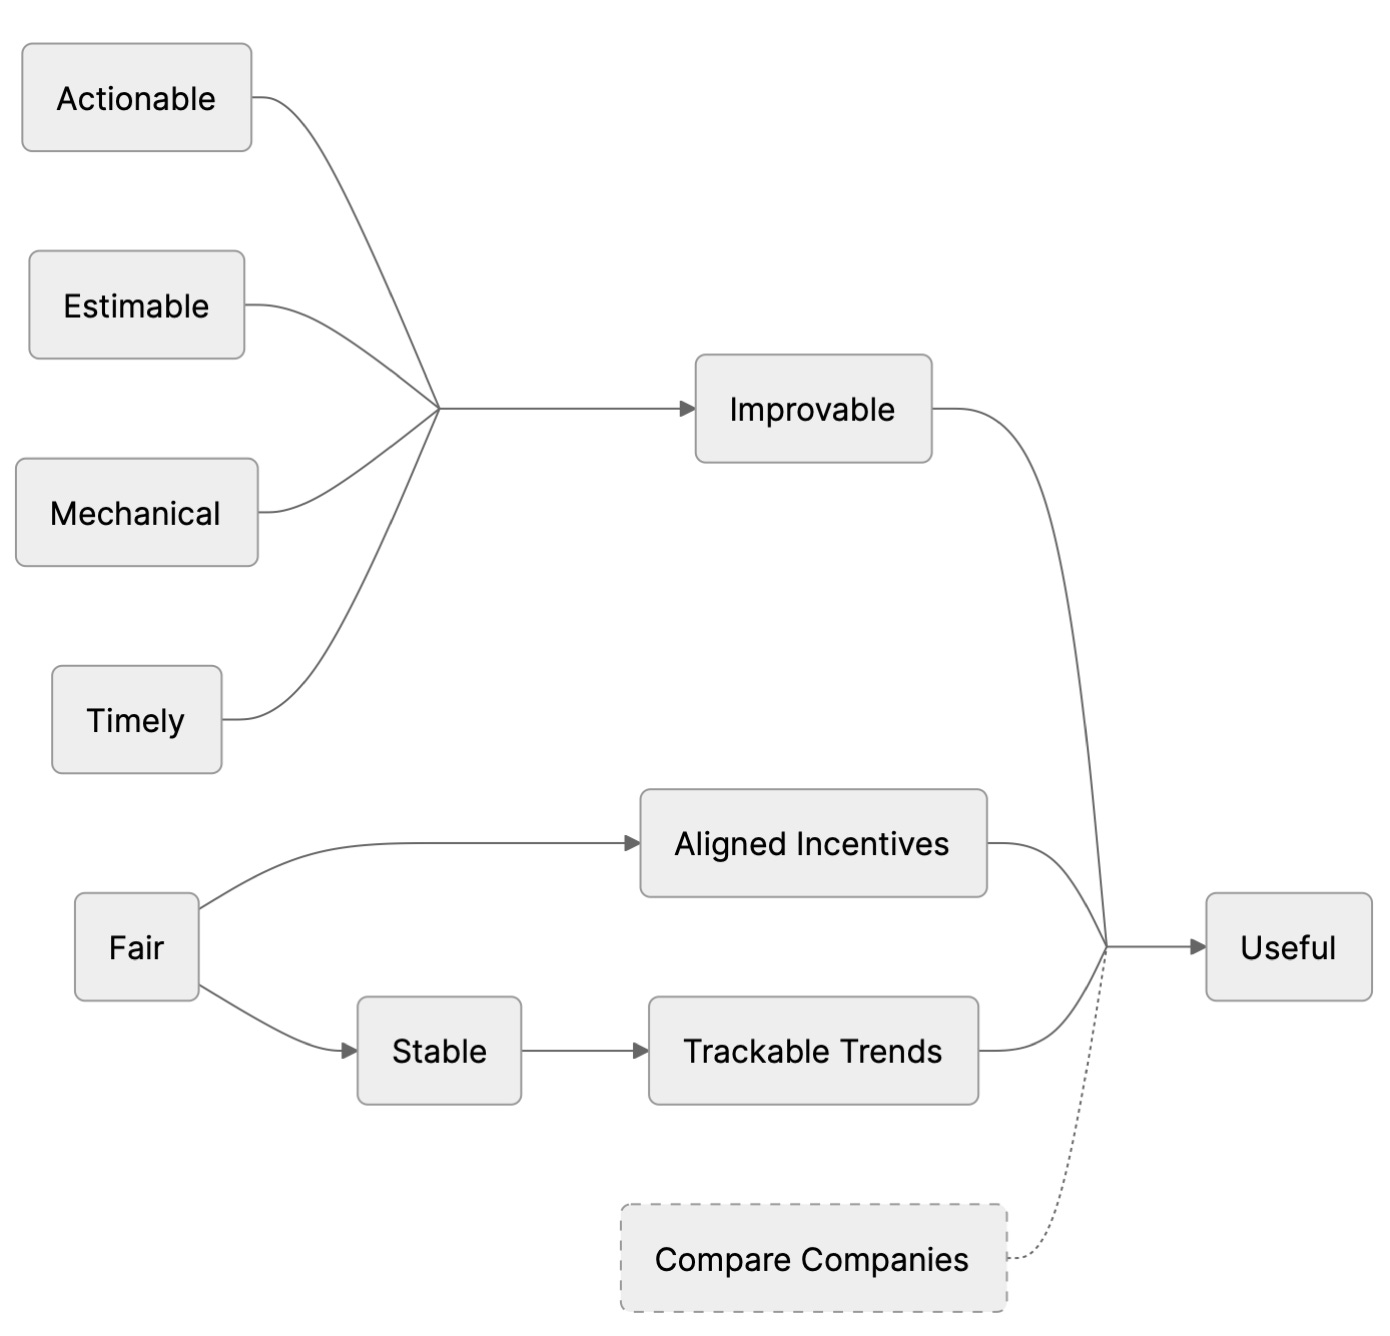
For my formula to help departments improve, it must be:
Actionable — department heads must be able to determine which factors influence their scores, and be able to control or influence the values of as many as possible of these factors.
Estimatable — department heads must be able to [at least] estimate their current situation to confirm that they are improving. Therefore, It must also be straightforward to calculate or update, i.e., not too intricately pedantic.
Mechanical — application of the formula must be mechanical, i.e. not subject to discussion, nor pending the CEO or CFO’s as yet unknown, or even unpredictable, interpretation of recent happenings.
Timely — the raw data to calculate the scores must be available regularly, in a timely manner that allows department heads to iterate and improve.
In order to ensure incentives are aligned, the formula must appear to be fair. Fairness also promotes stability (less squabbling → fewer changes), which is a prerequisite for tracking values over time.
ROI Formulae & Application
In The Hitchhiker’s Guide to the Galaxy by Douglas Adams, the Deep Thought supercomputer calculates the “Answer to the Ultimate Question of Life, the Universe, and Everything” to be the number 42. Unfortunately, after 7.5 million years, no one knew what the actual question was, thus rendering the answer somewhat meaningless.
Similarly, when attempting to calculate the ROI of an engineering department, we must clarify to ourselves the specific questions we want answered. In doing so, it is also helpful to anticipate how these answers might influence our subsequent actions.
It turns out that the accounting world already has a formula for ROI, and in the case of SaaS companies, the answer might as well be 42.
ROI Formula - Formal Accounting Version
This is a simple ROI formula for a company. It quite simply means that your company’s ROI is your gross profit divided by your costs of generating it. Ideally it’s a positive multiple, or you can represent it as a percentage.
The question this formula answers is, “For every dollar we spend on delivering our product or service, how much extra money do we get back?”
Cost of Revenue is a term that has quite a narrow definition. It will typically include only the direct costs associated with keeping your service operational for customers. Not salaries of engineers who are building new features, and not (for example) your cloud CI/CD service. This definition is designed to eliminate noise when comparing the financial performance of different companies.
In a manufacturing scenario, the above question could be stronger: “For every additional dollar we spend on delivering our product or service, how much extra money can we expect to get back?” In the SaaS scenario, where costs do not vary much with the number of customers, the above formula will not answer this question. However, it’s not needed; the answer is zero.
This means that formulae based on Cost of Revenue will fail to capture much of what a software engineering department does.
Marketing Efficiency Ratio
Marketing is another department whose activities are not captured by Cost of Revenue. The Marketing Efficiency Ratio (MER) provides a holistic impression of departmental ROI.
A nuance to note here is that they don’t deduct their direct costs — they are just looking for a simple multiple to track. Also, they don’t include salary costs of operating the marketing department. This could be fine for marketing — their raw materials costs are for advertising — but engineering’s main raw material is human brainpower, and the chief costs are in the form of salaries.
Engineering ROI Questions
A SaaS company’s engineering department does two main things:
Operate and maintain the company’s product or service.
Improve the product or service and develop new capabilities.
That’s how the engineers may see things. From a more outcomes-based perspective, these are the purposes of the engineering department:
Retain existing customers, or at least don’t give them a reason to leave.
Attract new customers, or enable efforts to do this.
These two sets don’t map onto each other exactly2, but holistically speaking, they are reasonably close.
Somewhat paradoxically, many SaaS companies spend the bulk of their engineering budget on building new features, while the majority of their revenue comes from serving their existing customers.
This situation encourages two distinct ROI questions:
“How much revenue is supported by each dollar we spend on operating and maintaining the service?”
“How much new revenue is enabled by each dollar we spend on improving the service and developing new capabilities?”
Engineering Operating Efficiency Ratio
Question: “How much revenue is supported by each dollar we spend on operating and maintaining our product or service at the current level?”
This question produces a simple ratio: the revenue attributed to existing customers, divided by the cost of keeping the system running smoothly.
In order to apply this formula, we need to define the terms, and obtain or calculate their component values.
Revenue from Existing Customers
We are calculating values pertaining to a specific time period — the “reporting period”. Revenue from existing customers consists of total payments received from customers that were already paying customers — not free users — prior to the start of the reporting period. Do not confuse this with the amount of monthly recurring revenue (MRR) at the start of the reporting period.
Revenue from existing customers will naturally be affected by these phenomena:
Account upgrades (“expansions”) that existing customers made, from one paid tier to another, e.g. from Pro to Enterprise.
Price increases that your company instituted.
Churn.
KTLO Costs
If all you had to do was to keep your service operating at current levels, how much would it cost you? What percentage of your current engineering and DevOps capacity does it require?
You’d still probably need cloud environments for development and staging, as well as a CI/CD system, and of course Jira (or equivalent).
Here’s a list of typical expenses:
Direct expenses of production:
Troubleshooting customer issues and fixing production bugs
On-call employee compensation
Servers or cloud compute instances
Databases and object storage
Networking services (CDN, API gateways, load balancers, etc.)
Security and regulatory compliance tools, services and work
Backups and snapshots
Logging, alerting and observability
Data warehouse
Replicated resources for resilience and disaster recovery
Any other 3rd party API or service fees (production only)
Appropriate fractions of indirect expenses, that I nevertheless include (see “Classify Engineering Costs as OpEx or CapEx” below):
Development and staging environments
Software subscription costs, e.g. GitHub, Cursor, Jira.
Any other 3rd party API or service fees (development)
Departmental expenses, such as:
Salary costs (these are higher than gross salaries, due to employment taxes, health insurance, investment schemes, etc.)
Travel, team-building, training expenses, etc.
Rent and utilities
Shared burden of internal services such as HR, legal, etc.
Laptops and other equipment
Examples of “appropriate fractions” (above):
If KTLO only requires 10 people, attribute the cost of 10 Jira licences to KTLO.
If 20% of days worked were spent on KTLO, attribute 20% of your salary costs to KTLO.
If something has a fixed cost (or a minimum cost), and is necessary for KTLO, then attribute 100% of the cost (or the cost of the minimal package) to KTLO.
Engineering Growth Efficiency Ratio
Question: “How much new revenue is enabled by each dollar we spend on improving the service and developing new capabilities?”
This question produces a simple ratio: the amount of revenue attributed to new customers divided by the cost of improving the service and developing new capabilities.
Revenue from New Customers
Revenue from new customers consists of total payments received from entities that became paying customers during the reporting period. Note that this is not the same as the amount of MRR at the end of the period.
Amortisation
Amortisation is a way of spreading the recognition of costs over an expected payback period. See “Classifying Engineering Costs as OpEx or CapEx” below.
Classify Engineering Costs as OpEx or CapEx
To begin to answer these questions, you need to classify all your engineering costs as either operating expenses (OpEx) or capital expenditure (CapEx). Your CFO probably already does this, possibly using rough estimates, or according to “financial engineering” principles that may not reflect your CTO’s version of reality.
The way engineering departments operate, including the tools and systems they use for development and testing, is a critical part of a company’s secret sauce of “manufacturing” its product or delivering its service. It’s akin to a purpose-built manufacturing facility. As such, I want to consider all of engineering’s operating expenses, rather than be limited strictly to what accountants include in Cost of Revenue. This also has the advantage of simplifying things somewhat.
Operating Expenses
In this context, operating expenses (OpEx) include anything you spend on keeping your product or service operating smoothly, in its current state and level of service3.
Capital Expenditures
Capital expenditures (CapEx) include the costs of improvements you make to your product or service, and anything you invest in new capabilities — basically any investments that are intended to increase the value of your product. In this specific context, CapEx will generally be anything that is not OpEx.
CapEx Amortisation
It often takes quite a while for a new feature to start delivering results, and its productive lifetime can last for years. The simple fact is that most of a feature’s payback will not arrive during the reporting period in which the feature was delivered.
Were we to recognise the costs immediately, it would inflate our costs in the current reporting period. These costs are chiefly unrelated to the revenue that arrived during this period. When this feature’s revenue arrives later, it will be as if by magic, because it will not have any corresponding development costs. This would render our ratio misleading.
Therefore, treat all capital investments as though they were spread over 3 years (for example). If our reporting period is a quarter (3 months), include (“recognise”) 3/36 = 8.33% of the total cost in each period. Your CFO calls this “amortisation.”
Restated Formula
Based on the above, we can restate our engineering ROI formulae:
Track Capital Expenditures in Aggregate
Don’t attempt to track launch dates and amortisation periods for individual projects or tasks — it snowballs too quickly into a thankless task.
A little-known, but sad fact is that most capital investments will fail to recoup any business value. When you realise one has failed, you could decide to write it off as an immediate loss. Don’t do this, for the same reason as above. Unless you want to handle an exceptional case, it’s just too nitpicky.
It is sufficient to track your aggregate capital investment for each period, and have a spreadsheet distribute it over the following 3 years.
Classifying and Tracking Costs
You need to track two main things:
Direct monetary costs — These are things you forked out money for, and are naturally tracked on a spreadsheet in units of money. Attribute each expense to OpEx or CapEx based on its purpose. Where appropriate, split the attribution to reflect the relative amounts consumed by each category.
Effort — Track effort invested in OpEx and CapEx. Translate this into money by expressing effort expended (for example, in terms of man-days worked, or number of people assigned) as a percentage of your total capacity, and then multiplying by your total salary costs. Use Jira’s (or whatever work queue system you’re using) tagging or custom fields to classify epics/stories into appropriate categories for this.
Conclusion
Is calculating engineering ROI the right thing to do? And is it fair to collapse all of engineering’s activities into a pair of numbers? Two short answers:
Someone will do this anyway. When done naïvely, the results can be unintentionally destructive. I’d rather you had a framework for doing it constructively.
Fairness isn’t the point — usefulness is. Used appropriately — and not as a scorecard to punish offenders — an ROI model can be very useful.
However, engineering ROI is more about the journey than the destination. Figuring out the right questions is of critical importance. The moment you start being explicit about ROI — and have deliberate conversations about it with your CEO, CFO and peers — you will naturally start aligning and optimising for ROI.
I have proposed two complementary formulae for measuring engineering ROI. But beware: the ability to measure ROI does not magically give you the ability to generate ROI — which is arguably far more important. The simplicity of the formulae hides the wealth of strategies, techniques and judgement calls that the CTO or VP of Engineering needs to employ in order to consistently deliver, demonstrate and boost ROI. That’s what I do with clients over a period of months.
Acting on the above ideas will stop “What is engineering’s ROI?” being a trap question that freezes you like a deer in headlights, and convert it into an opportunity for you to align incentives, focus your company’s roadmap, and defend the budgets you genuinely need. It’s how you’ll ensure that the value of your engineering organisation — with you at its head — becomes obvious to everyone in the room.
CTOs and Engineering VPs:
Come to my next free online workshop that gets you started immediately with practical steps for engineering your pathway to ROI.
Forward this article to your CEO and/or CFO to start aligning your joint ROI vision.
CEOs and CFOs:
Bring your CTO and work with me together, to design and implement your pathway to maximise your company’s engineering ROI. Book a meeting, or send me a message containing the phrase “ROI article” via my LinkedIn profile.
I discovered an unfortunate way to get obvious credit for such improvements. They need to happen routinely, and then a new CTO (me) comes in and undertakes successful efforts to reduce or prevent the damage.
Operating and maintaining the service supports existing customers, and is also obviously a prerequisite for onboarding new customers. New features could be needed in order to open up new market segments, or to appeal to a wider set of potential customers, but they might also help retain existing customers by keeping the service competitive.
This is explicitly the current level of service your company has chosen to deliver, not the theoretical minimum sustainable level.
That's a must-read for tech leads. A deep article about a topic that so many CTOs struggle with or don't even realize as their problem.
Your restated ROI formulae for Operating and Growth efficiency provide a much-needed framework for CTOs. Often, the 'Keep The Lights On' (KTLO) costs are viewed as a burden, but they are the bedrock of retained revenue. Balancing this with amortized CapEx for new capabilities is exactly how we should be discussing engineering budgets at the executive table.